Point maps
Use point maps when the exact position of discrete events or values matters, not for continuous surfaces. Draw them on the data-led basemap, with the point symbols.
Choosing a visual variable
| To show… | Use |
|---|---|
| Quantities | Size |
| Categories | Colour, or up to three shapes |
| Intensity or density | Merging nearby points, clustering or binning |
Use one primary variable. Use colour or size for meaning, and use other variables only to make the map legible. Combine size and colour only when both are equally important.
Event map
Each dot is one event, or several events merged at one location. Use it when the precise location matters, such as distance to a town, border or route.
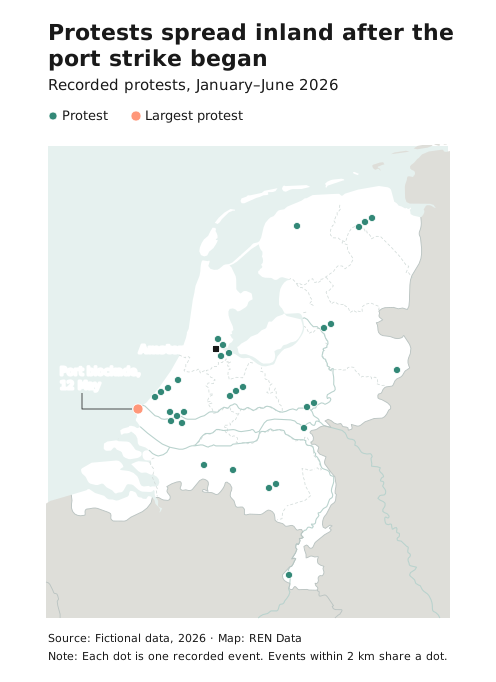
- Draw each dot as a 7 px circle with a 0.75 px white stroke.
- Use one category, in Teal, where possible. Split into categories only when the split is the story.
- Mark the one event to read first in Coral, and annotate one or two events, not every cluster.
- Avoid it with too many points, or when you need to show amounts (use proportional circles).
- Leave out the key when the title explains what a dot is. Avoid insets on event maps.
- If events at nearby locations share a dot, say so in a note: “Events within 2 km share a dot.”
- For dot density maps, where each dot is a fixed amount placed at random within an area, state clearly that dots aren’t exact locations.
Proportional circles
Circle size shows an amount at a location. This is how to show counts where points overlap: group them into one circle.
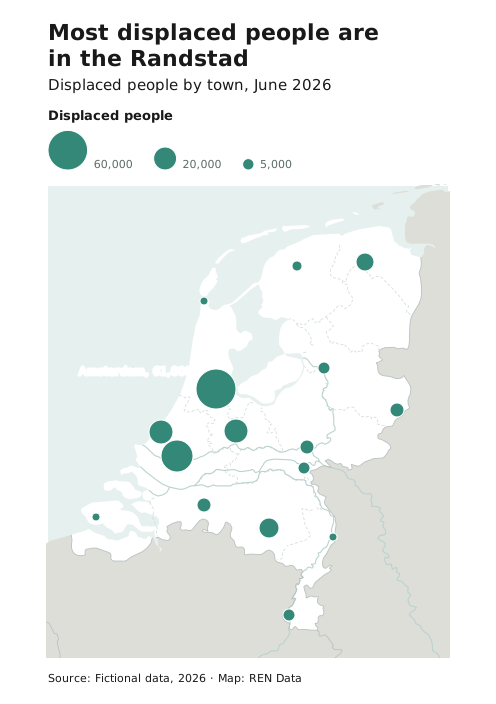
- Avoid them when the range of values is too small, such as only 1 and 2.
- Scale by area, not radius. Make the smallest circle at least 4 px.
- Always include a size key with round values, because readers judge sizes poorly.
- Draw the larger circles first, so that smaller ones sit on top, and separate them with a 1 px white stroke.
Annotated map
Short text gives context for selected points. Use it when readers need to know why particular points matter.
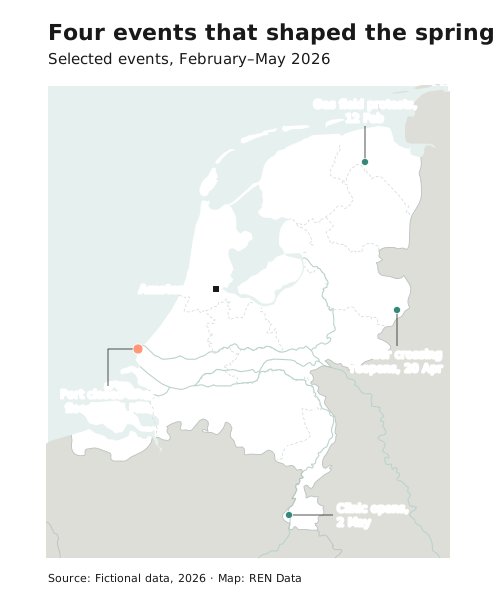
- Avoid it with many annotations or a complicated key.
- Write in headline style: short, and with the most important words first. Longer text goes beside the map.
- Set annotations in label style: regular 11 px Ink with a halo, and a short straight leader line of 0.75 px. Don’t put them in boxes.
Overplotting
When points pile up, try these in order:
- A white stroke around each point
- Merging events at nearby locations into one dot, and saying so in a note
- Jittering, if exact positions aren’t critical
- Cluster markers, for interactive maps
- Switching to proportional circles or a hexbin map
Test interactive maps at several zoom levels, and check that the symbols stay clear and meaningful at each one.