Axes and baselines
Must the y-axis start at zero?
Readers often complain when a chart’s y-axis doesn’t start at zero. Whether it should depends on the chart type, the data and the story (Yanofsky, 2015).
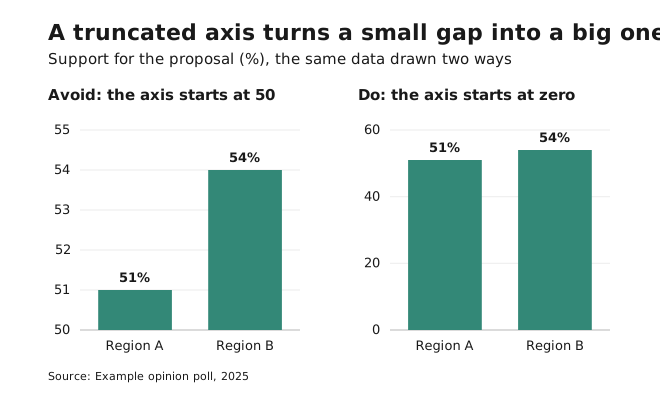
- Bars and areas: always zero. These encode values as length or area. If the axis is truncated, the bar lengths are no longer proportional to the values, and the chart misleads.
- Lines and dots: it depends. These encode values as position. A truncated axis can reveal a meaningful change that a zero baseline would flatten, as long as the axis is labelled clearly.
- Use a truncated axis when zero is irrelevant or impossible. Body temperature or labour-force participation will never be zero, so including zero wastes space and hides the movement.
- Use zero when it doesn’t hurt. If the story is just as clear with a zero baseline, keep it.
- Log scales have no zero. Say clearly that the scale is logarithmic.
The guide’s rules (bars and areas from zero, lines optionally not) come straight from this.
How people read scatter plots
Rensink and Baldridge (2010) measured how accurately people perceive correlation in scatter plots. People systematically underestimate moderate correlations: a correlation of 0.5 looks much weaker than “half”.
In practice, don’t expect readers to see a moderate correlation unaided. If the relationship is the message, state it in the title and add a trend line based on a real calculation.
Sources: Yanofsky (2015), Quartz; Rensink & Baldridge (2010), The perception of correlation in scatterplots. See references.