Chart layout
Every chart uses the same template. Elements marked “required” always appear. Include the others only when they help.
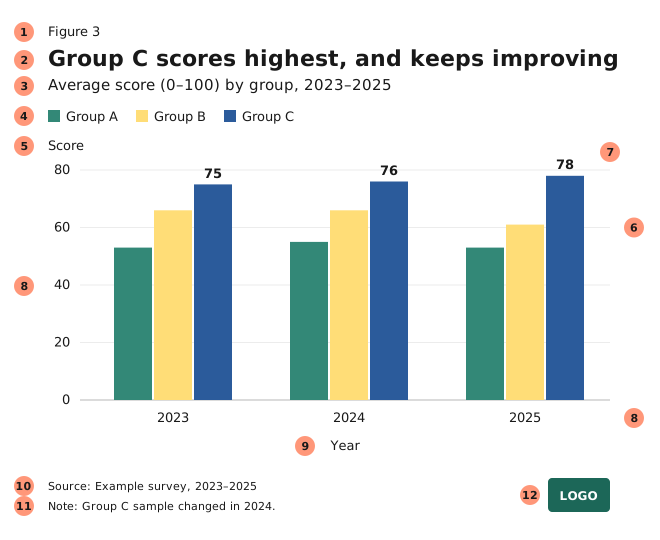
| # | Element | Guidance | |
|---|---|---|---|
| 1 | Figure number | optional | Use when the text refers to the chart. |
| 2 | Title | required | The main message, stated as a takeaway. One line if possible. |
| 3 | Subtitle | required | What is shown: measure, units, categories, period and place. |
| 4 | Legend | if needed | Only when the categories can’t be labelled directly. Place it above the plot, left-aligned, in data order. |
| 5 | Y-axis title | if needed | Only when the units aren’t in the subtitle. Put it horizontally above the axis. If it’s too long, move it into the subtitle. |
| 6 | Gridlines | optional | Light (Platinum) and horizontal only. They help when values aren’t labelled directly. |
| 7 | Data labels and annotations | preferred | Label the data instead of the axis. Put labels outside the bars where they fit. Use annotations or shading to point out key values and events. |
| 8 | Axis values | if needed | Only when the data isn’t labelled directly. Use no axis line on the value axis, and a Steel baseline at zero. |
| 9 | X-axis title | if needed | Only when the units aren’t in the subtitle. Centre it below the axis. |
| 10 | Source | required | Always. Give the organisation and dataset, then the year. |
| 11 | Note | optional | Explain choices and data limitations, such as “Excludes unverified reports.” |
| 12 | Logo | required for published visuals | Bottom right. Follow the brand guidelines: don’t stretch or recolour it. |
Text
- Write titles in plain words. Don’t use acronyms unless every reader knows them.
- Round numbers in labels to the precision the message needs, usually two or three significant figures, and use the same number of decimals throughout a chart.
- On the web, give every chart and map alt text that states the message and the key numbers, and link to the data where you can.
- For case, alignment, sizes and weights, see Typography.
Spacing
- Bars
- Make each bar 67% of its slot and leave 33% as gap. In Excel, that’s a gap width of 50%.
- Clustered bars
- Bars within a cluster touch or nearly touch, and the gap between clusters is about half a bar wide.
- Margins
- Leave equal space on all sides, and align everything to the left edge of the title.
Long category labels
If the labels don’t fit, try these in order:
- Switch to a horizontal bar chart, if the data allows.
- Label every second or third value: dates, for example.
- Abbreviate (“Jan”, “‘25”), and explain the abbreviations in a note if needed.
- Rotate the labels. This is a last resort.
To make your own template, keep the numbered list and change only the positions and the logo rules to fit your brand. Build it once as a real chart template (an Excel .crtx file, a ggplot theme or a Plotly template) so that nobody has to apply it by hand.