Comparison charts
Horizontal bar chart
The default chart. Use it to compare values across categories and to show rankings. It has room for long labels and reads from top to bottom.
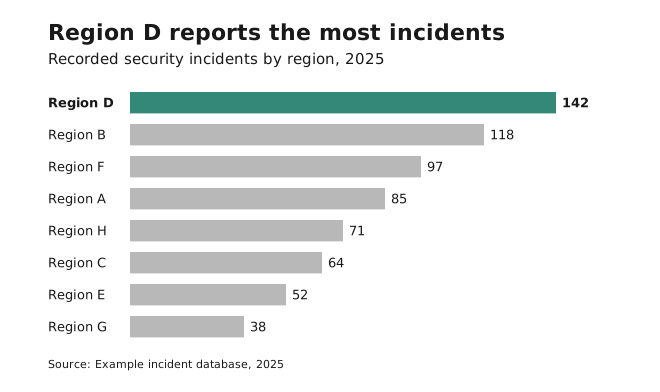
- Avoid it when categories have a fixed order such as dates (use a column chart), or when the values are continuous rather than categorical (use a histogram or line chart).
- Sort bars meaningfully: high to low, or with the key category on top.
- Use one colour for all bars, or highlight one.
Always start the value axis at zero.
Column chart
A vertical bar chart. Use it when categories have a natural order, especially time: months, years, age groups.
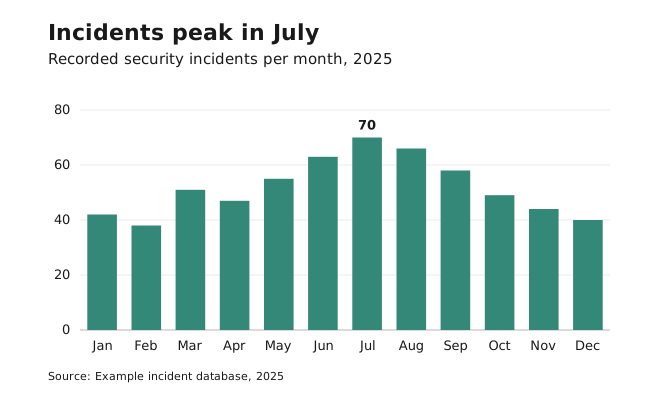
- Avoid it with long category labels or for rankings. Use horizontal bars instead.
- Always start the value axis at zero.
- If the labels don’t fit, see long category labels.
Clustered bar chart
Also called a grouped bar chart. Use it to compare subcategories within each category, when comparing the parts matters more than comparing the totals.
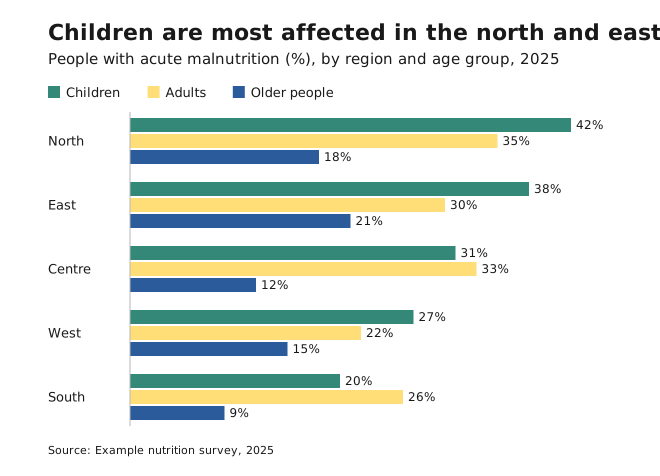
- Avoid it when clusters get crowded, or when the totals matter more. Use a stacked bar or small multiples instead.
- Keep the same series order and colours in every cluster.
- In Excel, missing category–subcategory pairs leave empty gaps. Fill them with zeros or restructure the data.
Small multiples
A grid of small charts of the same type, one per category, all on the same scales. Use it when one chart would hold too many overlapping series, such as more than four lines.
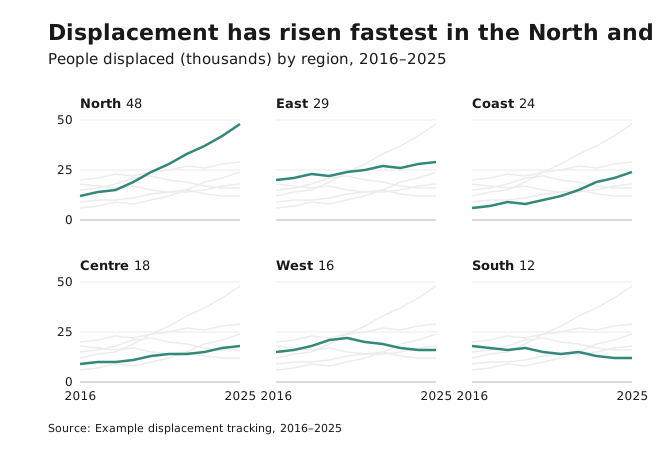
- Avoid them when readers need to compare exact values between panels. Put those series in one chart instead.
- Use the same axes in every panel, and label the axes only on the outer panels.
- Sort the panels meaningfully, such as by the latest value, not alphabetically.
- Show the other categories in Platinum behind each panel’s own line, so each panel can be read against the whole.
Lollipop and dot chart
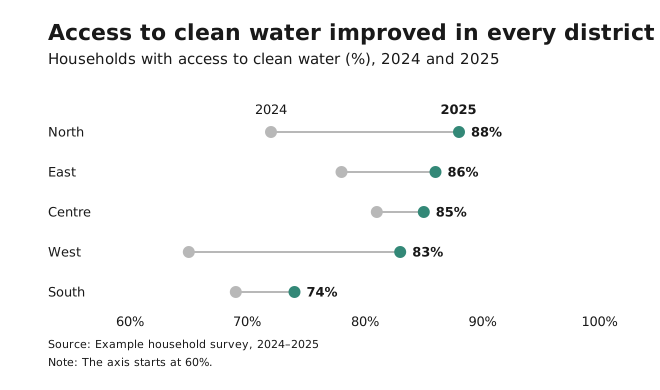
A lighter alternative to bars, for when values sit close together, such as when everything is between 80% and 90%. In a dot or dumbbell chart, the dot marks the value, so the axis may start above zero. A lollipop’s stem encodes length like a bar, so its axis starts at zero.
- Avoid it when you can’t label points directly: a dot far from its axis label is hard to read off.
- Keep the stems thin and Steel, so the dots are the focus.
- A dumbbell chart (two dots joined by a line) shows before and after, or two groups, per category.
Bars must start at zero because readers judge bars by their length. Dots and lines encode position, which is why their axes may start elsewhere. See Axes and baselines.