Relationship charts
Scatter plot and bubble chart
A scatter plot shows the relationship between two numeric variables, with one point per observation. A bubble chart adds a third numeric variable as point size.
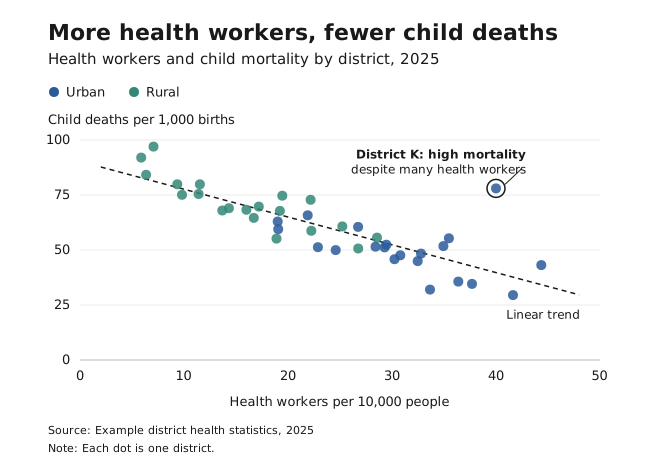
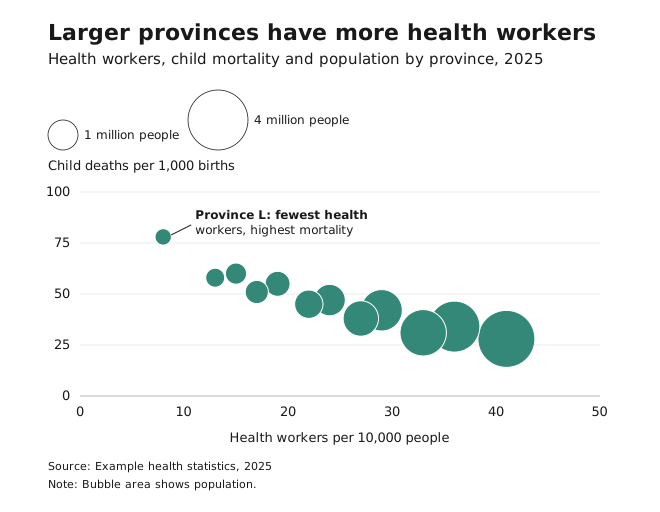
- Use it to show correlations, clusters, patterns and outliers, including in large datasets.
- Avoid it with categorical data or only a few points, and for totals, rankings or part-to-whole data, which are better as bars, lines or pies.
- Avoid bubble charts when the third variable barely varies, or when bubbles would overlap heavily.
- Keep axis scales consistent across panels, because changing the scale changes how strong a correlation looks.
- With many points, use transparency, jitter or aggregation such as hex bins.
- Scale bubbles by area, not radius, and include a size legend.
- Trend or target lines are optional. If you add one, label it, and only use real calculations.
- Annotate the outliers or clusters that make your point. Readers won’t find them on their own.
Slope chart
A slope chart shows the change between two points in time for several categories, with one line per category.
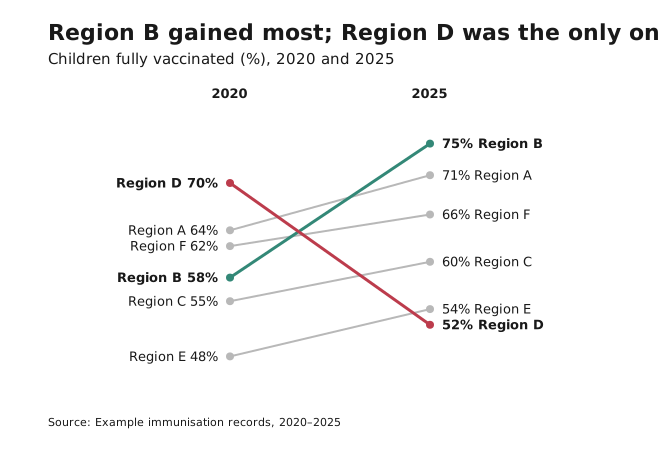
- Use it when the story is “who went up and who went down”.
- Label both ends of each line directly, and highlight the lines that matter.
People underestimate moderate correlations in scatter plots. See Axes and baselines.