Area maps
Choropleth map
Use it to colour areas by a relative value, such as a rate, percentage, density or change.
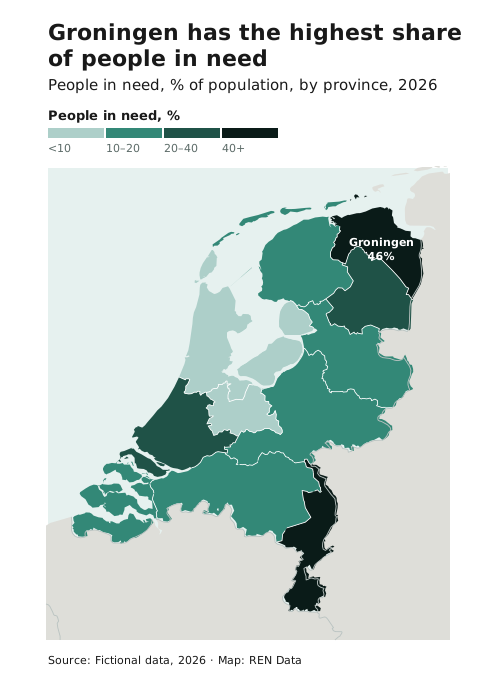
- The data must be normalised. Show incidents per 100,000 people, not incident counts. Counts make large areas look important regardless of the actual values.
- Avoid it for raw counts of events (use a point map), when there are very few or very many areas, and when you’d need to put other data on top.
- Draw the borders between filled areas in white, so the fills stay clean. Neighbouring countries keep the context land tone.
- Label the area the title talks about with its value.
- When admin areas vary greatly in size, or don’t match the pattern, use a hexbin map.
Colour scales
Use the Teal ramp for ordered values. Maps use their own fixed step sets instead of the chart steps. They start at Teal 3, so the lightest class never reads as sea or empty land, and run to Teal 10, so neighbouring areas still differ: 3, 6, 8, 10 for four classes and 3, 5, 6, 8, 10 for five.
#ADCFC9#5CA092#338877#1F5247#0A1B18Use a diverging ramp only when the data has a meaningful midpoint, such as change from last year. On maps, use the Baltic–Cherry pair from step 3, for the same reason.
#22497C#AABDD7#F9F9F9#E4B1B7#96303DFor areas with no data, use a hatch of #EAE6DD on #F8F5EF at 135°, the same pattern used everywhere else. Never use the lightest ramp step.
#EAE6DD on #F8F5EFSee Sequential and Diverging for how the ramps are built.
Choosing classes
Look at the histogram of your values first.
| Histogram shape | Classification | Why |
|---|---|---|
| Clusters and gaps | Natural breaks (Jenks) | Puts the breaks in the gaps. A good default. |
| Skewed, with a long tail | Quantiles | An equal number of areas per class, so no classes are empty. |
| Evenly spread, or a fixed scale such as 0–100% | Equal interval | Intuitive, round class ranges. |
| Bell-shaped | Standard deviation | Shows deviation from the average, and outliers. |
- Comparing several maps? Use the same breaks on all of them: set them by hand, or calculate them once from all the maps’ values together.
- Extreme outliers? Avoid equal interval. Use natural breaks or quantiles.
- Round the class boundaries to readable numbers.
- Don’t tune the breaks to make the map say what you want.
Use 4–5 classes by default and never more than 7. Beyond that, readers can’t match shades to the key.
Hexbin map
A choropleth on a grid of equal hexagons instead of admin areas. Use it when the whole area is evenly relevant, there are many overlapping points, and the exact locations don’t matter. It’s a good replacement for a smoothed density heatmap.
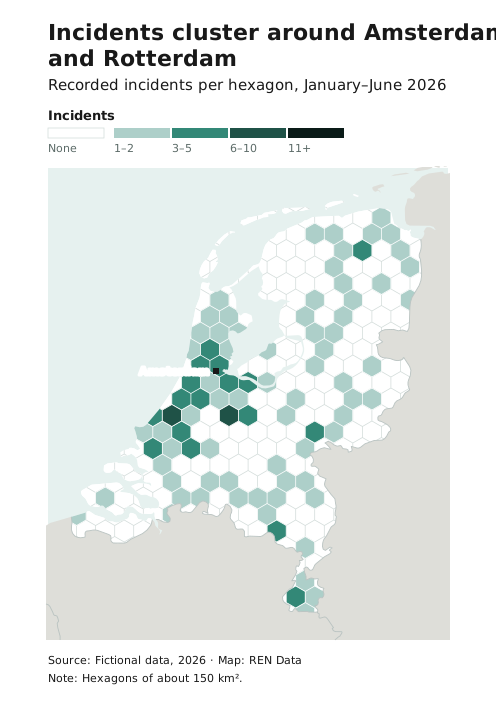
- Choose a hexagon size that suits the map scale and the density of the data, and state it in the subtitle or a note: “Hexagons of 50 km²”.
- Follow the choropleth rules: at most 4–5 classes plus “no data”, and a distinct “no data” or “no incidents” style.
- If admin areas tell the story, use a choropleth instead.
Chorochromatic and areas of control maps
Use these to colour areas by type, not amount: who controls an area, access conditions, land use. Use the map colour order, which carries no order of value. Never use a ramp.
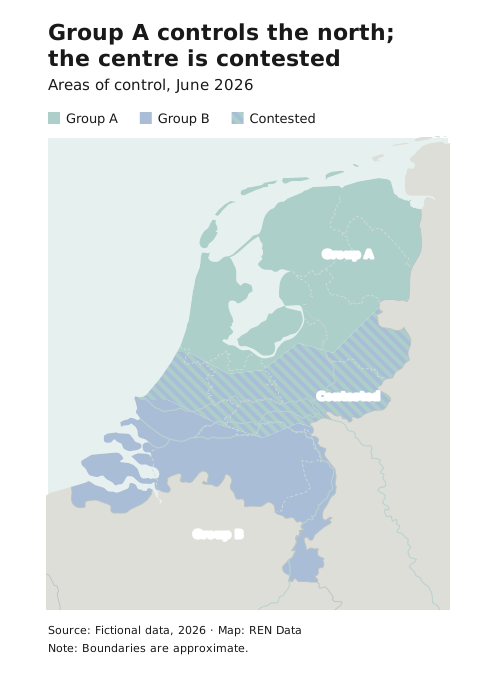
- Keep the number of categories small, at most four, and make sure they don’t overlap. If they do overlap, show it with a hatch or a separate colour.
- For areas of control, use custom polygons drawn to the real extent, not admin areas, unless control really follows admin boundaries. Fill them with a light step (2 or 3) of each category’s ramp, rather than a transparent fill, so the colours stay exact and the basemap lines still show through on top.
- You may use colours already associated with specific actors, as long as they stay distinguishable.
- Avoid putting other data on top.
To point out an area without classifying it, use a highlight area instead.