Maps
Map only when geography matters. Differences between areas, trends and relationships are often clearer as a chart. See Before you make a map.
A map answers one question about a place. Everything on it either helps answer that question or comes off. The house style starts from news-graphics cartography: light land, quiet water, few labels and one highlight colour.
Choosing a map type
Find what you want to show, then answer the questions about your data.
Pointing out a place, area or route? Usually a reference or locator map
- Is it just where something is, with no data attached? → Reference or locator map
- Do you need to draw attention to an area, such as where something changed? → Highlight areas
- Do a few selected points need context or explanation? → Annotated map
Showing data for areas? Usually a choropleth
- Is it a rate, percentage or intensity per administrative area? → Choropleth (coloured areas)
- Is it a type or category per area, such as control or access? → Chorochromatic or areas of control map
Showing events or locations? Usually an event (dot) map
- Does the exact location of each event matter? → Event (dot) map
- Are there amounts at each location, or overlapping points? → Proportional circles
- Are there so many points that density matters more than exact location? → Hexbin map
Showing movement or a continuous surface?
- Are things moving between places? → Routes and flow map
- Does a value vary smoothly across space, such as travel time or temperature? → Isoline map
Rules for every map
Choose the simplest basemap that supports the message. The basemap is context, and must never compete with the data. See Basemaps and symbols.
Show one message per map. If the map gets cluttered, split it into several maps or small multiples.
Check legibility at the final size. A map that works full-screen may be unreadable at A4 or on a phone.
The same story, twice
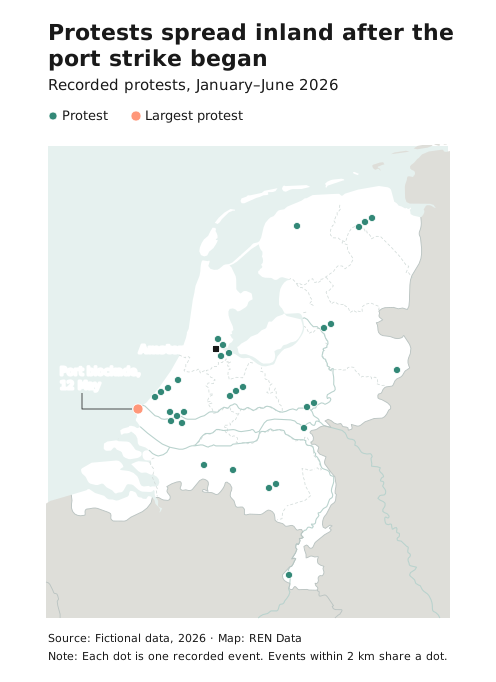
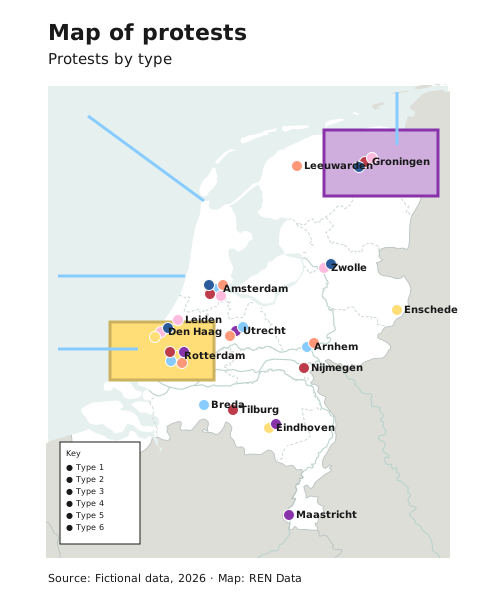
Both maps show the same fictional protests in the Netherlands. The first keeps what the title needs. The second gives every attribute its own colour, every place a label and every area a fill.