Change over time
For discrete periods, such as years or quarters, where each period is a separate total, use a column chart. For continuous series, use the charts below.
Line chart
Use it for trends, peaks and dips in continuous data, to compare several series on the same axis, and to emphasise the rate of change rather than individual values.
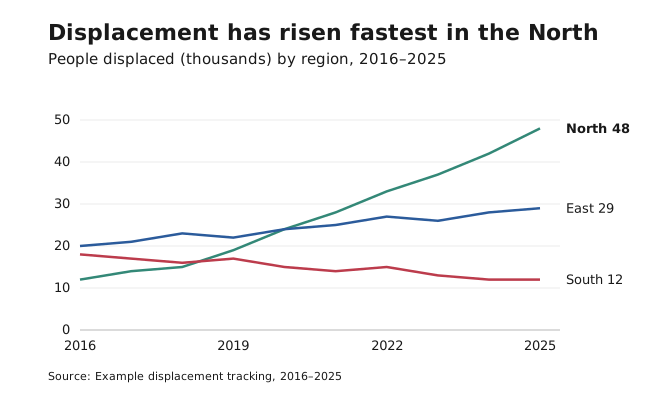
- Avoid it for discrete categories or aggregated totals (use bars), and for part-to-whole composition (use a stacked area chart).
- The y-axis may start above zero when the point is a small relative change, as long as the axis values make the range clear. Start at zero when comparing absolute size.
- Line charts can show data at uneven intervals: add markers so the spacing is visible.
- Label lines directly at their right end instead of using a legend.
- Don’t distinguish lines by colour alone. Add direct labels, line weight, line style or markers. Use the dark data colours (Teal, Baltic, Cherry) for lines.
Area chart and stacked area chart
An area chart fills the space under a line to emphasise size rather than just the rate of change. A stacked area chart layers series to show how a total is made up.
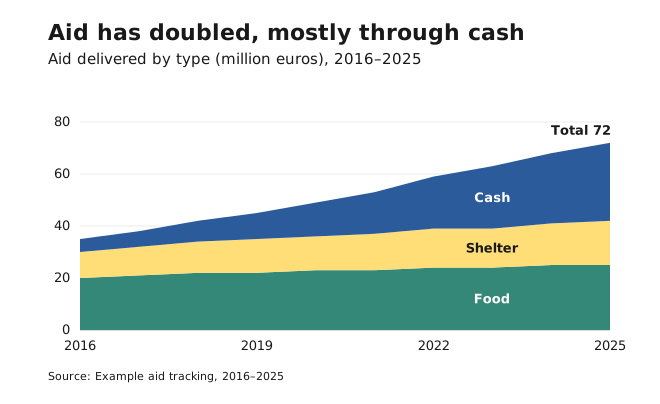
- Avoid it when series overlap and hide each other, or when trends are very spiky.
- In stacked areas, only the bottom series has a straight baseline. Don’t use them when readers need exact values for each series.
- Put the most stable or most important series at the bottom.
Always start the y-axis at zero.
Lines encode position, not length, which is why their axis may start above zero. See Axes and baselines.