Plan and layout
How to decide what a dashboard is for, lay it out on one grid, and title tiles whose data keeps changing.
Purpose and questions
Write a brief as you would for any visual, and add three answers:
- Type
- Strategic dashboards track a few headline measures for management. Operational dashboards help staff act on today’s situation. Analytical dashboards let specialists explore causes. Pick one. A dashboard that tries to be all three serves nobody well.
- Decisions
- List the questions it answers and what a reader might do differently after looking at it. Leave out any measure that doesn’t feed one of those decisions.
- Refresh
- How often does the data update, and how often will people look? A weekly meeting needs weekly data, not a live feed.
Then give every visual one question. If you can’t write the question in a sentence, the visual doesn’t belong on the page. On a full page, this test often removes one or two visuals, and the page gets better.
- A table is a full visualisation. When readers need to check, copy or forward the numbers, a table is the right answer and a chart the wrong one. That happens more often on a monitoring dashboard than in a presentation.
- A map is rarely the answer. Use one only when the question really is about place. “Which countries get the most?” is a sorted bar chart. See Before you make a map.
One dashboard, one audience. If strategic and operational readers both need the data, build two views. Don’t build one view with every filter. See Audience and attention.
Layout
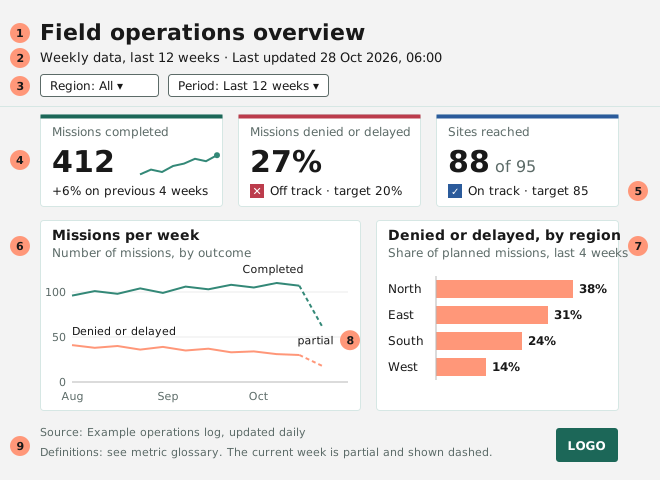
| # | Element | Guidance | |
|---|---|---|---|
| 1 | Title | required | Names the dashboard and its subject. Descriptive, not a takeaway: see titles. Page tabs sit beside it. |
| 2 | Scope and last updated | required | Period, selection and the date and time the data was last refreshed, filled in from the data. |
| 3 | Filters | if needed | In one place, showing the current selection: in the header for one or two filters, in a rail on the left for three. |
| 4 | KPI row | required | Four big numbers, all built the same way, each with a comparison. |
| 5 | Status signal | if needed | Shows whether a measure is on target: a square with a sign, and a word. See status colours. |
| 6 | Trend | preferred | How the headline measures have moved over time. |
| 7 | Breakdown | preferred | The same measures split by region, team or category. |
| 8 | Partial period | if needed | Mark incomplete periods, such as the current week, with a dashed line or lighter fill. |
| 9 | Source and definitions | required | Data source, update schedule and a link to the metric definitions. |
Fit it on one screen. A reader should take in the whole dashboard without scrolling, at the screen size they actually use. Eight visuals is the maximum. That limit comes from the reader, not the tool: more than eight means there is no main question.
Put the most important things at the top left, and work from overview to detail: KPIs first, then the main visual, then supporting visuals and any detail table. Readers scan in that order, and most stop early.
The grid
Build every page on one grid, so that tiles line up across pages and reports.
- Canvas
- 1920 × 1080 pixels, the size of a full-HD screen.
- Columns
- 16, with a 24-pixel margin and a 16-pixel gutter. Every visual starts on a column and spans whole columns.
- Bands
- A header across the top, then a KPI row, a main band for the visual that carries the page, and a supporting band below it. A one-line footer closes the page.
- Sizes
- KPI tiles are three or four columns wide. A filter rail is four columns. The main visual takes seven to ten.
The REN Data design system gives the exact positions and heights.
Use one quiet tile. Every visual sits on the same tile, on a light grey canvas: white, a 1-pixel hairline, small corners, no shadow. Separate groups with space and alignment. Leave out heavy borders, shadows and header bands in colour.
Readers group things that are close together, so space and alignment do the grouping. The tile only marks where each visual ends, which a dashboard tool needs anyway. See Gestalt principles.
Titles on live data
A takeaway title such as “Incidents fell by a third” turns false the next time the data refreshes. On a dashboard that updates:
- The title says what is shown; the subtitle says what it means. “Disbursement by quarter” is the title. “61% of the annual budget, against 74% at this point last year” is the subtitle, and the data writes it. Readers shouldn’t have to work out the point from the axes.
- Put the rest of the takeaway in the data too: a comparison on every KPI, a status signal, and notes for known events.
- If someone reviews the dashboard regularly, add a short note, “What changed this quarter”, at the bottom of the filter rail.
Don’t type anything that moves with the data. No typed numbers, dates or period names in titles, subtitles, notes or the footer. Each one is a claim that stops being true after the next refresh or filter change. Fill them in from the data.
A note about an outlier still belongs with that outlier, but on a dashboard the chart will soon show another period. So the note has to exist as data: a table of notes by item and period, which the dashboard filters along with everything else. That takes more work than a text box. It’s the difference between a note that is correct and a note that once was.
This is the one exception to the takeaway-title principle. A snapshot of a dashboard pasted into a report is a normal chart again, and gets a takeaway title.