Distribution charts
Distribution charts show how the values of a continuous numeric variable are spread and where they cluster, rather than only totals or averages.
| Chart | Shows | Best for |
|---|---|---|
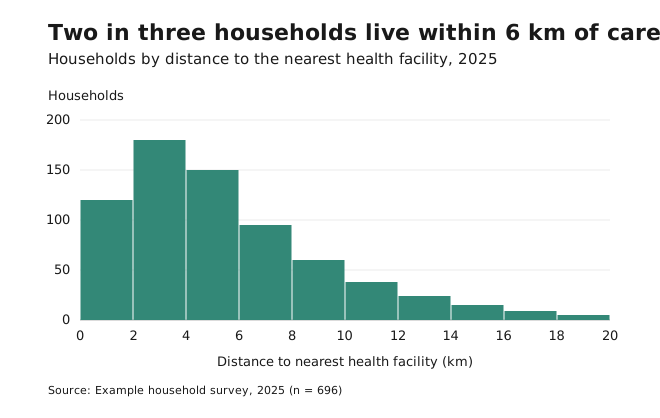
| Histogram | Counts per value range (bin) | The overall shape of one continuous variable |
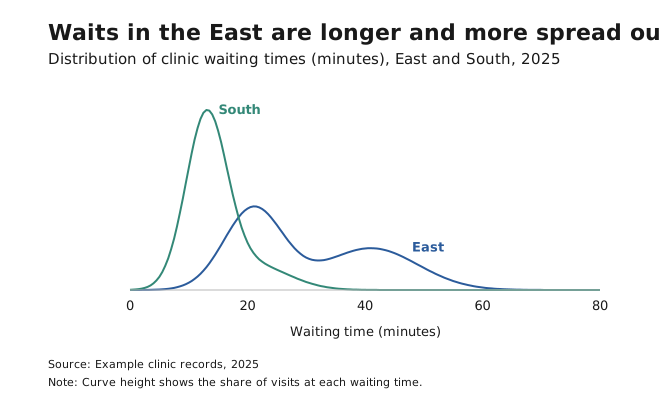
| Density plot | A smoothed histogram | Comparing the shapes of two or three groups |
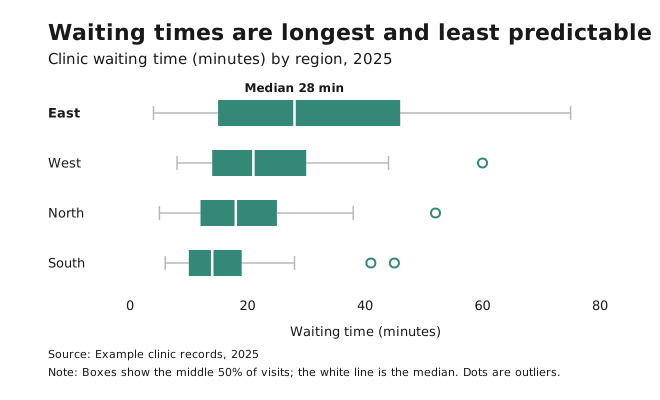
| Box plot | Median, quartiles and outliers | Comparing many groups compactly |
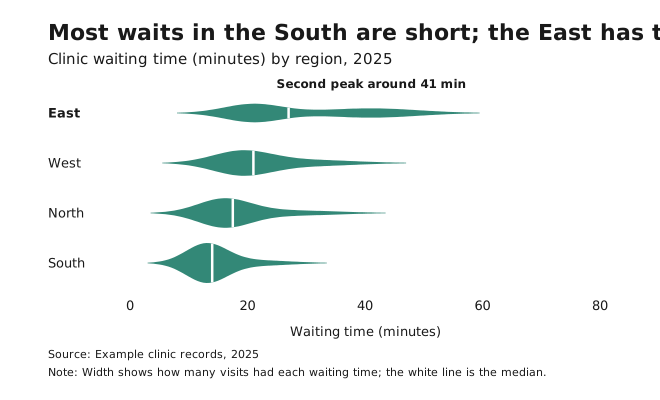
| Violin plot | A box plot with density shape | Many groups, when shape matters |
- Avoid them for audiences unfamiliar with statistical charts (for them, describe the distribution in words or use a simple histogram), for very small datasets, and when exact values matter more than patterns.
- With too many bins, a histogram shows noise. With too few, it hides patterns. Try several bin sizes, and pick round-number bin edges.
- Decide deliberately whether to explain, transform or show outliers separately. Don’t just let the axis stretch.
- A histogram is also the quickest way to choose map classes.