Basemaps and symbols
Choosing a basemap
Choose the simplest, least detailed basemap that still supports the message. To decide, ask:
- What is the map trying to show, and to whom?
- Will it be printed or viewed on screen?
- Does the basemap compete with the data for attention?
| Basemap | Use when | Notes |
|---|---|---|
| Country outline (shapefile or polygons) | No context outside the country is needed. This suits most integrated maps. | Show admin divisions only if the message needs them, and only at the level of the data: admin-1 data gets admin-1 boundaries. |
| Region outline (focus country plus neighbours) | The country needs geographic context, but the map needs no detail. | Add rivers and lakes only if the message needs them. |
| Light grey vector basemap (for example, ArcGIS Light Gray Canvas) | Readers need place names and roads for orientation. | The first choice among tiled basemaps: enough detail, without drawing attention. |
| Streets or topographic | The purpose requires detailed location or navigation context. | Use with care, as it competes with the data. |
| Terrain or hillshade | Terrain is part of the message. | The only case for relief shading. |
| Imagery | The data is remote sensing or environmental. | Raster imagery blurs when zoomed in. |
Don’t use a detailed, colourful basemap by default. It’s the most common reason a map looks busy.
Basemap colours
Draw your own outlines in one of two palettes. In both, the country the story is about keeps the lightest land tone.
Location maps
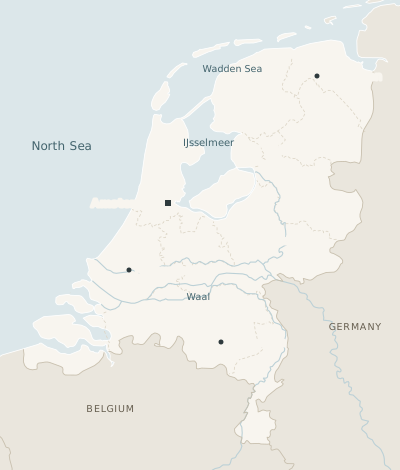
For locators, routes and highlight areas. Warm, low-saturation land with a white coastline of 0.75 px.
#DCE7EA#F8F5EF#EAE6DD#FFFFFF#C9C0AE#DCD5C6#BBD0D6#2E3A3D#665E4F#43646DData-led maps
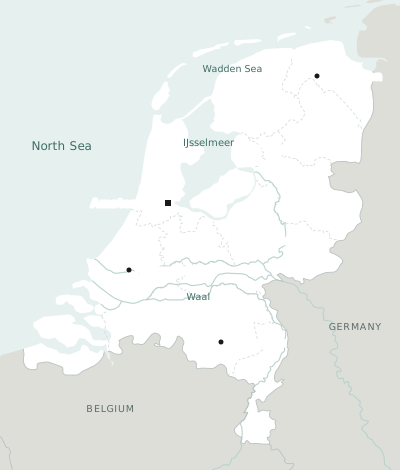
For events, choropleths and proportional symbols. White land on a faint teal sea, neighbours in neutral grey so the data colours do the work. No coastline.
#E6F1EF#FFFFFF#DEDED9#B9C2C0#D3DCDA#B9D2CD#191919#5C6B68#3F6D65Context land and sea differ in hue and in lightness on both basemaps: teal sea against grey land on data maps, blue-grey sea against stone on location maps. If a neighbour could be read as water, the basemap is wrong.
For the data colours on top, see Colour on maps.
Layer order
Bottom to top:
- Water
- Context land, then focus land
- Data fills
- Regional borders, then national borders
- Rivers and roads
- Areas
- Routes
- Points
- Labels
- Key and locator
Lines
Reference lines stay under 1 px, so that data lines at 2 px read clearly above them. Dashes mean less certain: a dashed border is regional or disputed, and a dashed route is suspected.
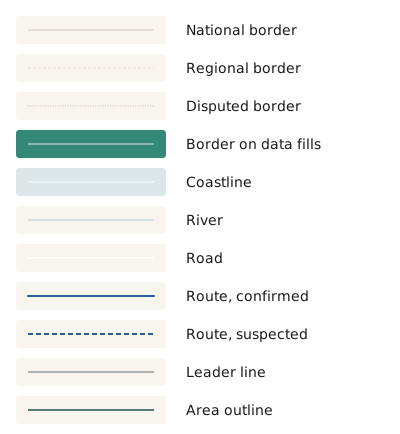
| Line | Style | Use |
|---|---|---|
| National border | 0.75 px · solid · #C9C0AE | |
| Regional border | 0.75 px · dashed 3 2 · #DCD5C6 | At most two nested admin levels, such as country plus province. |
| Disputed border | 1 px · dotted · #C9C0AE | |
| Border on data fills | 0.75 px · solid · white | Over choropleth fills, so the fills stay clean. |
| Coastline | 0.75 px · white | Location maps only. Data-led maps have none. |
| River | 1 px · solid · #BBD0D6 | Main rivers only. |
| Road | 1.5 px · solid · white | Only if the story is on it. |
| Route, confirmed | 2 px · solid · data colour · 7 px arrowhead | The subject of the map. Draw it on top. |
| Route, suspected | 2 px · dashed 5 3 · data colour | |
| Leader line | 0.75 px · Ink | Straight, horizontal or vertical. |
| Area outline | 1.5 px · #1F5247 · 2 px corners | Dashed if the area is possible rather than confirmed. |
Point symbols
Colour carries the category, and shape carries the type of place. Pictograms of planes, boats and oil drops look helpful in the key but turn into noise at map scale, so use plain geometric shapes and name them in the key. Use three shapes at most.
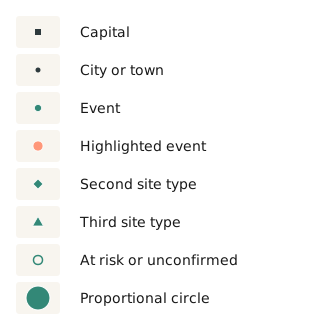
| Symbol | Style |
|---|---|
| Capital | 6 px square · Ink |
| City or town | 5 px dot · Ink |
| Event | 7 px circle · data colour · 0.75 px white stroke |
| Highlighted event | 10 px circle · Coral · one or two per map |
| Second site type | 10 px diamond · same colour rules |
| Third site type | 11 px triangle · same colour rules |
| At risk or unconfirmed | 9 px ring · 1.5 px · no fill |
| Proportional circle | Scaled by area · at least 4 px · 1 px white stroke |
Use an icon only when it’s the clearest way to show something, such as an ✕ for a road blockage. Keep icons few, simple and explained.
Colour on maps
Most maps need one data colour: Teal. Coral marks the single thing you want read first, such as the largest event or the place in the title. When categories are unavoidable, take colours in the map order below and stop at four.
#338877#2B5B9B#BC3C4C#8833AA#FF9779#1F5247The chart colour order is Teal, Jasmine, Baltic, Coral. On maps, Jasmine disappears into the warm land and Coral is kept for emphasis, so the map order skips both. Everything else follows the chart rules: Baltic and Violet are hard to tell apart with deuteranopia, so when all four colours are used, label directly or add shapes.
For choropleth ramps and the “no data” pattern, see Area maps.
Transparency, gradients, glows, and hillshade unless terrain is the message. Separate overlapping symbols with a white stroke, not by making them see-through.
Visual variables (position, size, colour, shape and so on) each suit different kinds of data. See Visual variables.
In your tools
The values are the same everywhere. In QGIS and Datawrapper, enter the hex codes by hand and keep the layer order above. In Python, start from these dictionaries. On location maps, also plot the coastline in white.
LOCATION = {
    "water": "#DCE7EA", "land": "#F8F5EF", "land_context": "#EAE6DD",
    "coast": "#FFFFFF", "border": "#C9C0AE", "region": "#DCD5C6",
    "river": "#BBD0D6", "ink": "#2E3A3D",
    "land_text": "#665E4F", "water_text": "#43646D",
}
DATA_LED = {
    "water": "#E6F1EF", "land": "#FFFFFF", "land_context": "#DEDED9",
    "border": "#B9C2C0", "region": "#D3DCDA",
    "river": "#B9D2CD", "ink": "#191919",
    "land_text": "#5C6B68", "water_text": "#3F6D65",
}
DATA = ["#338877", "#2B5B9B", "#BC3C4C", "#8833AA"]
ACCENT = "#FF9779"
REN_MAP = DATA_LED  # or LOCATION

fig, ax = plt.subplots(figsize=(8, 5), dpi=200)
ax.set_facecolor(REN_MAP["water"])
world.plot(ax=ax, color=REN_MAP["land_context"], edgecolor=REN_MAP["border"], linewidth=0.5)
focus.plot(ax=ax, color=REN_MAP["land"], edgecolor=REN_MAP["border"], linewidth=0.5)
events.plot(ax=ax, color=DATA[0], markersize=12, edgecolor="white", linewidth=0.5)
ax.set_axis_off()