Map layout
Two kinds of map product
Map elements
Every published map has the same frame as a chart. The title states the finding, and the subtitle says what is counted, where and when. The map sits on white with no border.
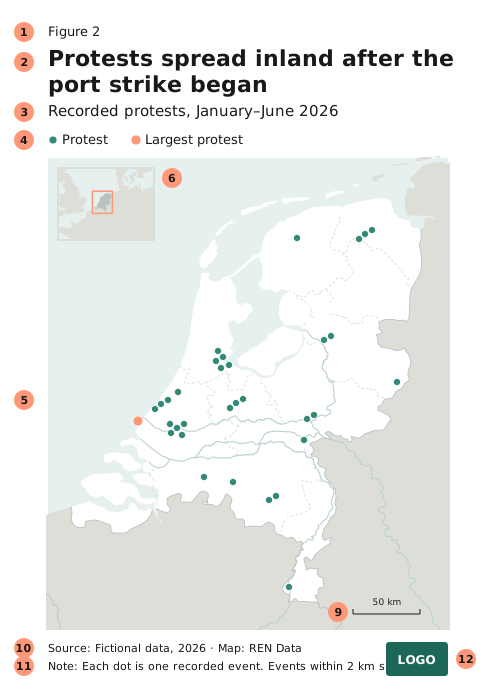
| # | Element | Guidance | |
|---|---|---|---|
| 1 | Figure number | optional | Use when the text refers to the map. |
| 2 | Title | required | Why you’re showing the map: the finding, in two lines at most. |
| 3 | Subtitle | required | What the map shows: what is counted, where, when, and the unit. |
| 4 | Key | if needed | One row between the subtitle and the map, with no box. See Key. |
| 5 | Map area | required | Full width, no frame. Build it at 800 px wide and export at 2×. |
| 6 | Locator map | optional | Shows where the map area is. See Locator map. |
| 7 | Inset (zoomed area) | optional | Shows a crowded or distant area at a larger scale. |
| 8 | North arrow | if needed | Only when north isn’t at the top. |
| 9 | Scale bar | if needed | Only when distances matter to the message. |
| 10 | Source | required | Credit both the data and the map layers: “Source: [dataset], accessed [date] · Map: [organisation]”. |
| 11 | Note | optional | Method notes in one short paragraph, such as “Events within 2 km share a dot.” Anything longer goes in the accompanying text. |
| 12 | Logo | required for published maps | Bottom right. Integrated maps use the symbol logo, and standalone maps use the full logo. |
The title, subtitle, source and note follow the chart type sizes. For text on the map itself, see Labels.
Elements by attention level
Use this table with the 3 / 30 / 300 rule.
| Element | 3 s (locator) | 30 s (narrative) | 300 s (exploration) |
|---|---|---|---|
| Title and subtitle | optional | ✔ | ✔ |
| Key | ✘ | ✔ | ✔ |
| Locator map or insets | ✘ | optional | optional |
| Scale bar, north arrow | ✘ | optional | optional |
| Source | ✔ | ✔ | ✔ |
| Full credits (map layers, partners) | ✘ | optional | ✔ |
| Neatline (frame) | ✘ | ✘ | optional |
| Additional graphics (charts, photos) | ✘ | ✘ | optional |
Key
Label first, key second. If the map shows one or two things, label them on the map and leave the key out. From three categories, use a key.
- Put it in one row between the subtitle and the map, left-aligned, like a chart legend. Read it left to right in the order the colours were assigned. Don’t put a box around it.
- A key never covers the map. On a standalone map sheet with a long key, put it in an empty corner at least 5 mm from the edge, and never over data.
- Don’t title it “Key” or “Legend”. Give a class or size key a title that names the measure and unit: “People in need, %”.
- List only the symbols that serve the map’s purpose. Leave out static features such as admin boundaries, cities, lakes and rivers.
- For class ranges, see Choosing classes. For size keys, see Proportional circles.
Key labels name the thing, not the symbol: “Battles”, not “Blue dots”. Round the class breaks, and put the units in the key title.
Locator map
A small map that shows where the main map is. Use either a country locator (where the country is in the world) or an area locator (which part of the country is shown), never both.
- Add a country locator only if most readers won’t know where the country is and they need to know to understand the point.
- Add an area locator when the main map is so zoomed in that the country’s outline isn’t recognisable.
- Make it a rectangle, not a globe, about 12% of the map width, in a top corner over water. It must not overlap the data.
- Draw the land in the context tone, the focus country one step darker, and the map extent as a Coral outline of 1.5 px. Leave out labels unless the region is unfamiliar.
Inset (zoomed area)
- Use an inset for areas that are too dense to read, or that are far from the main map.
- Mark the zoomed area on the main map with a box or arrow.
- Never let it overlap data on the main map.
- Use at most two. If you need more, split the map.
North arrow and scale bar
- Add a north arrow only when north isn’t at the top. Readers assume it is, and an arrow on a north-up map is one more thing to look past. Leave it out when the projection has no single north.
- Add a scale bar only when distances matter to the message. Draw one line with end ticks and a round distance in IBM Plex Sans, 9–11 px. Leave it out of world and continent maps, where the scale varies across the map.
- Place them in a free bottom corner, on whichever of land or sea is emptier.
Projection
Use a projection suited to the country for country maps: conic for mid-latitudes, transverse Mercator (UTM) near the equator. Use Equal Earth for world maps. Choropleths and anything else that compares areas need an equal-area projection, so never use Web Mercator for them.
Build your map template once in your GIS tool (an ArcGIS Pro layout or QGIS print layout) with every element in place. Delete what a map doesn’t need, rather than adding elements one by one.