Composition (part-to-whole)
Stacked bar and column chart
Use it to show how totals divide into parts across categories, for both the overall size and the contribution of each part. A 100% stacked bar compares proportions, and is the best choice when the data is already in percentages.
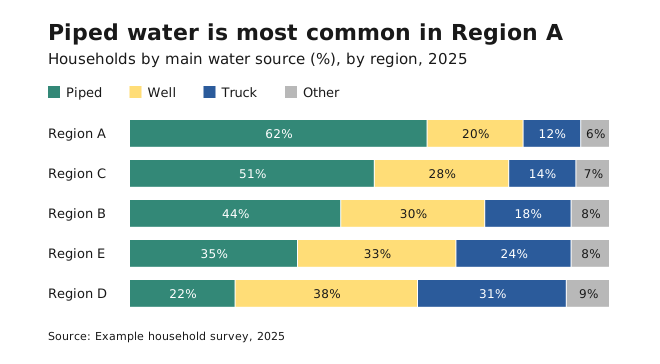
- Use horizontal bars for categories you can sort, and vertical columns for a time sequence.
- Avoid it when readers need to compare a segment’s exact value across bars. Only the first segment shares a baseline, so use a clustered bar or small multiples instead.
- Label segments directly, so readers don’t have to go back and forth to a legend.
- Keep the segment order the same in every bar, with the most important segment at the baseline.
Pie and donut chart
Use it for part-to-whole proportions of a few categories, especially data that is naturally expressed as percentages. A donut chart has room in the middle for a total or key figure.
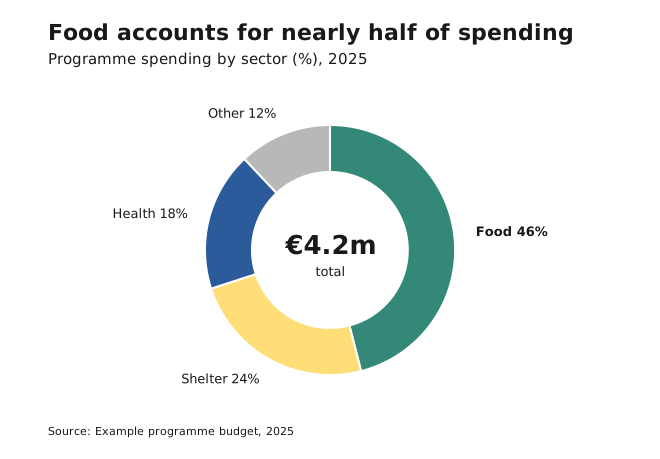
- Avoid it when slices are similar in size (differences under about 5 percentage points are hard to see), to compare values across categories (use bars), and for trends or distributions.
- Start the largest slice at 12 o’clock and go clockwise from largest to smallest.
- Group small slices into “Other”, and place “Other” last.
- Label slices directly with the category and the percentage.
- Slices must add up to 100%.
Treemap
Use it for how a whole divides into parts within a hierarchy, and to show which categories dominate a complex dataset.
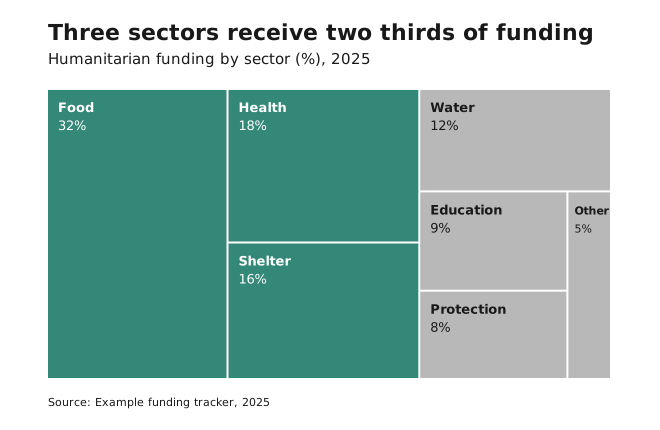
- Avoid it when precise comparison matters, or when the data isn’t hierarchical. Use a bar chart instead.
- Label rectangles directly, and keep the labels short, because long labels don’t fit in small rectangles.